We are expanding the arivis software product family under the trusted ZEISS brand to include APEER cloud and AI solutions. We believe that the consolidated eco-system for scientific image analysis will better serve our users. The changes to product names and branding will take place in phases in the upcoming year. Customers can continue to expect the quality and support excellence they are used to from the expanded ZEISS arivis platform.
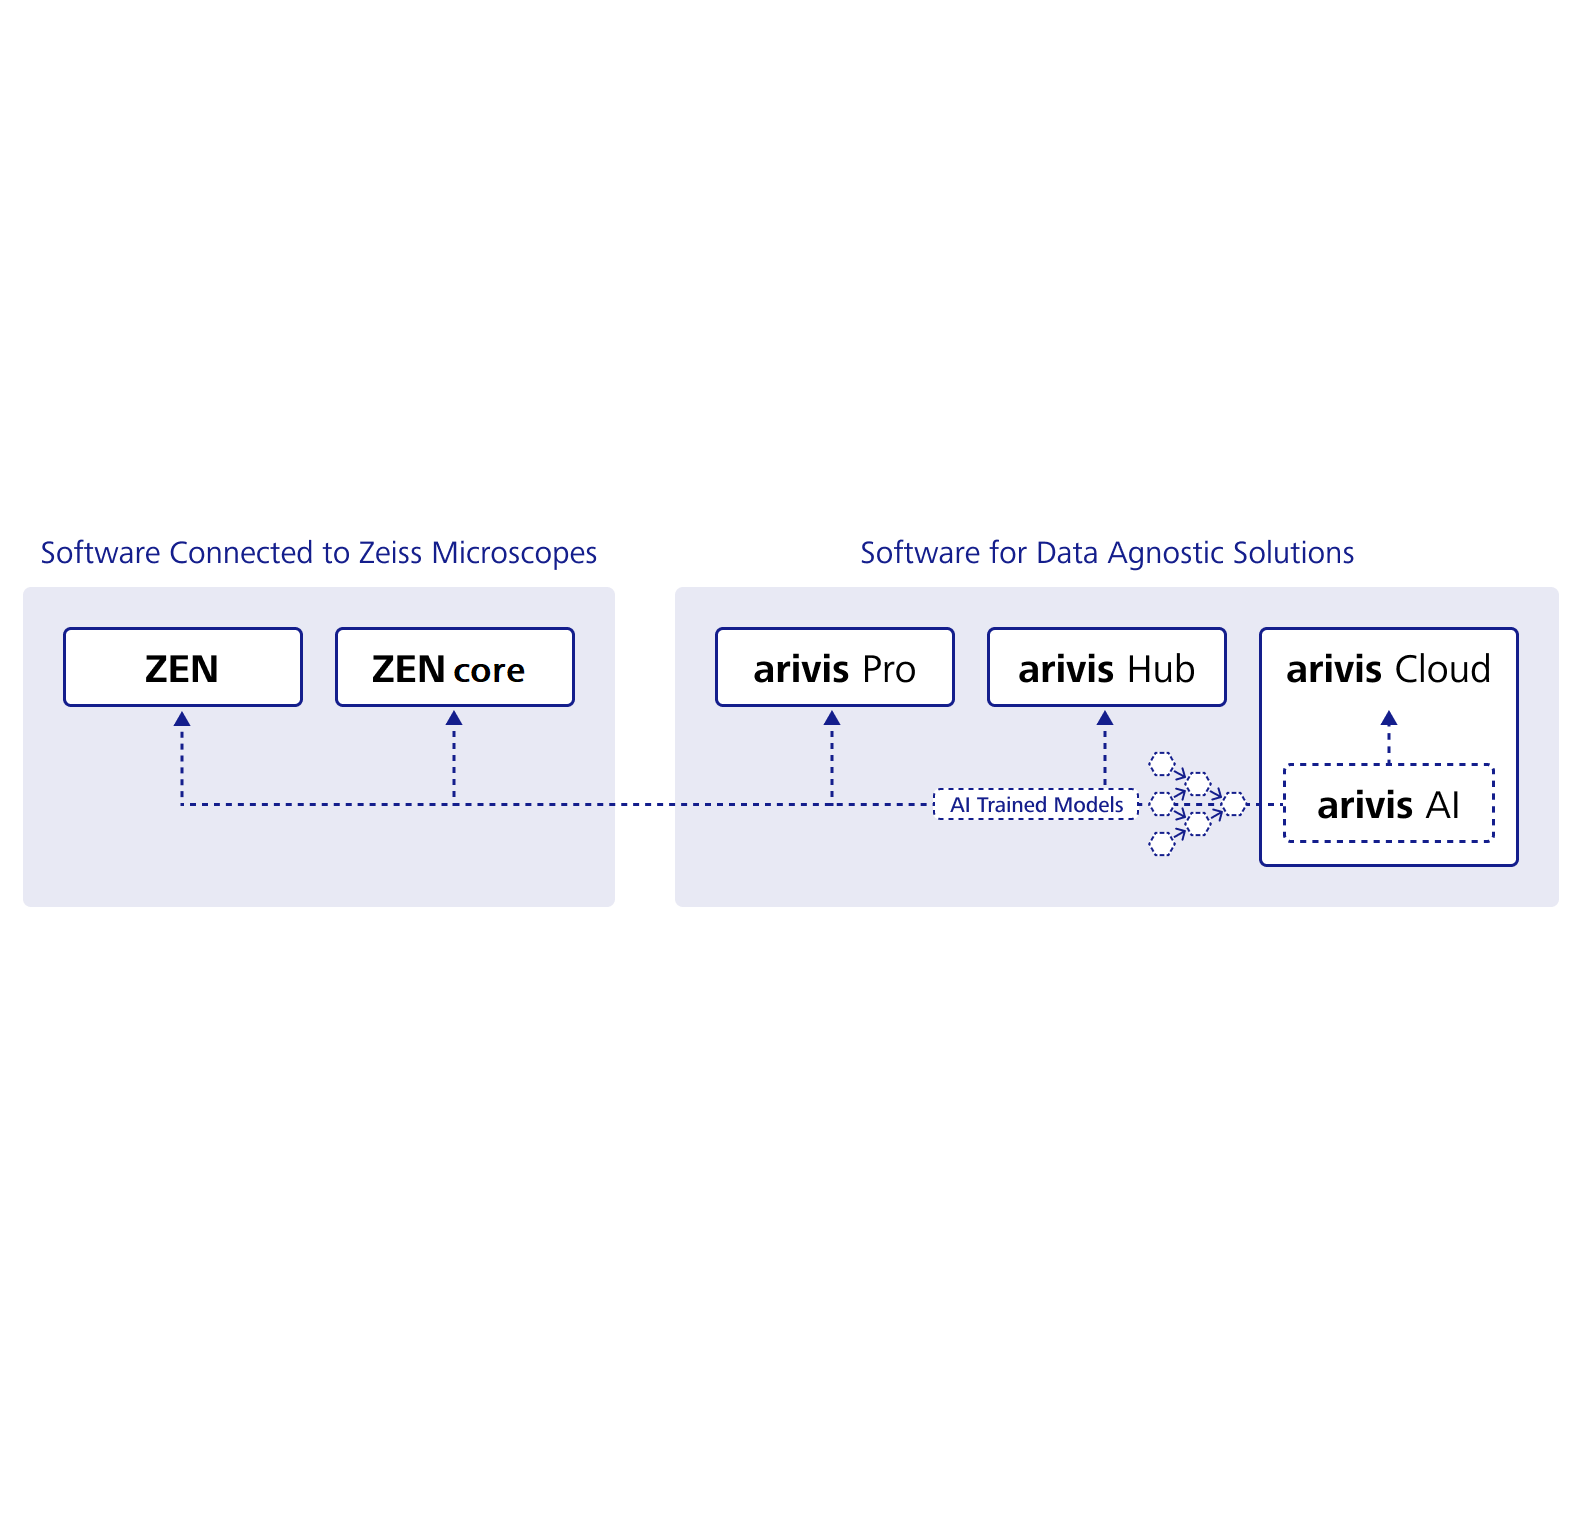
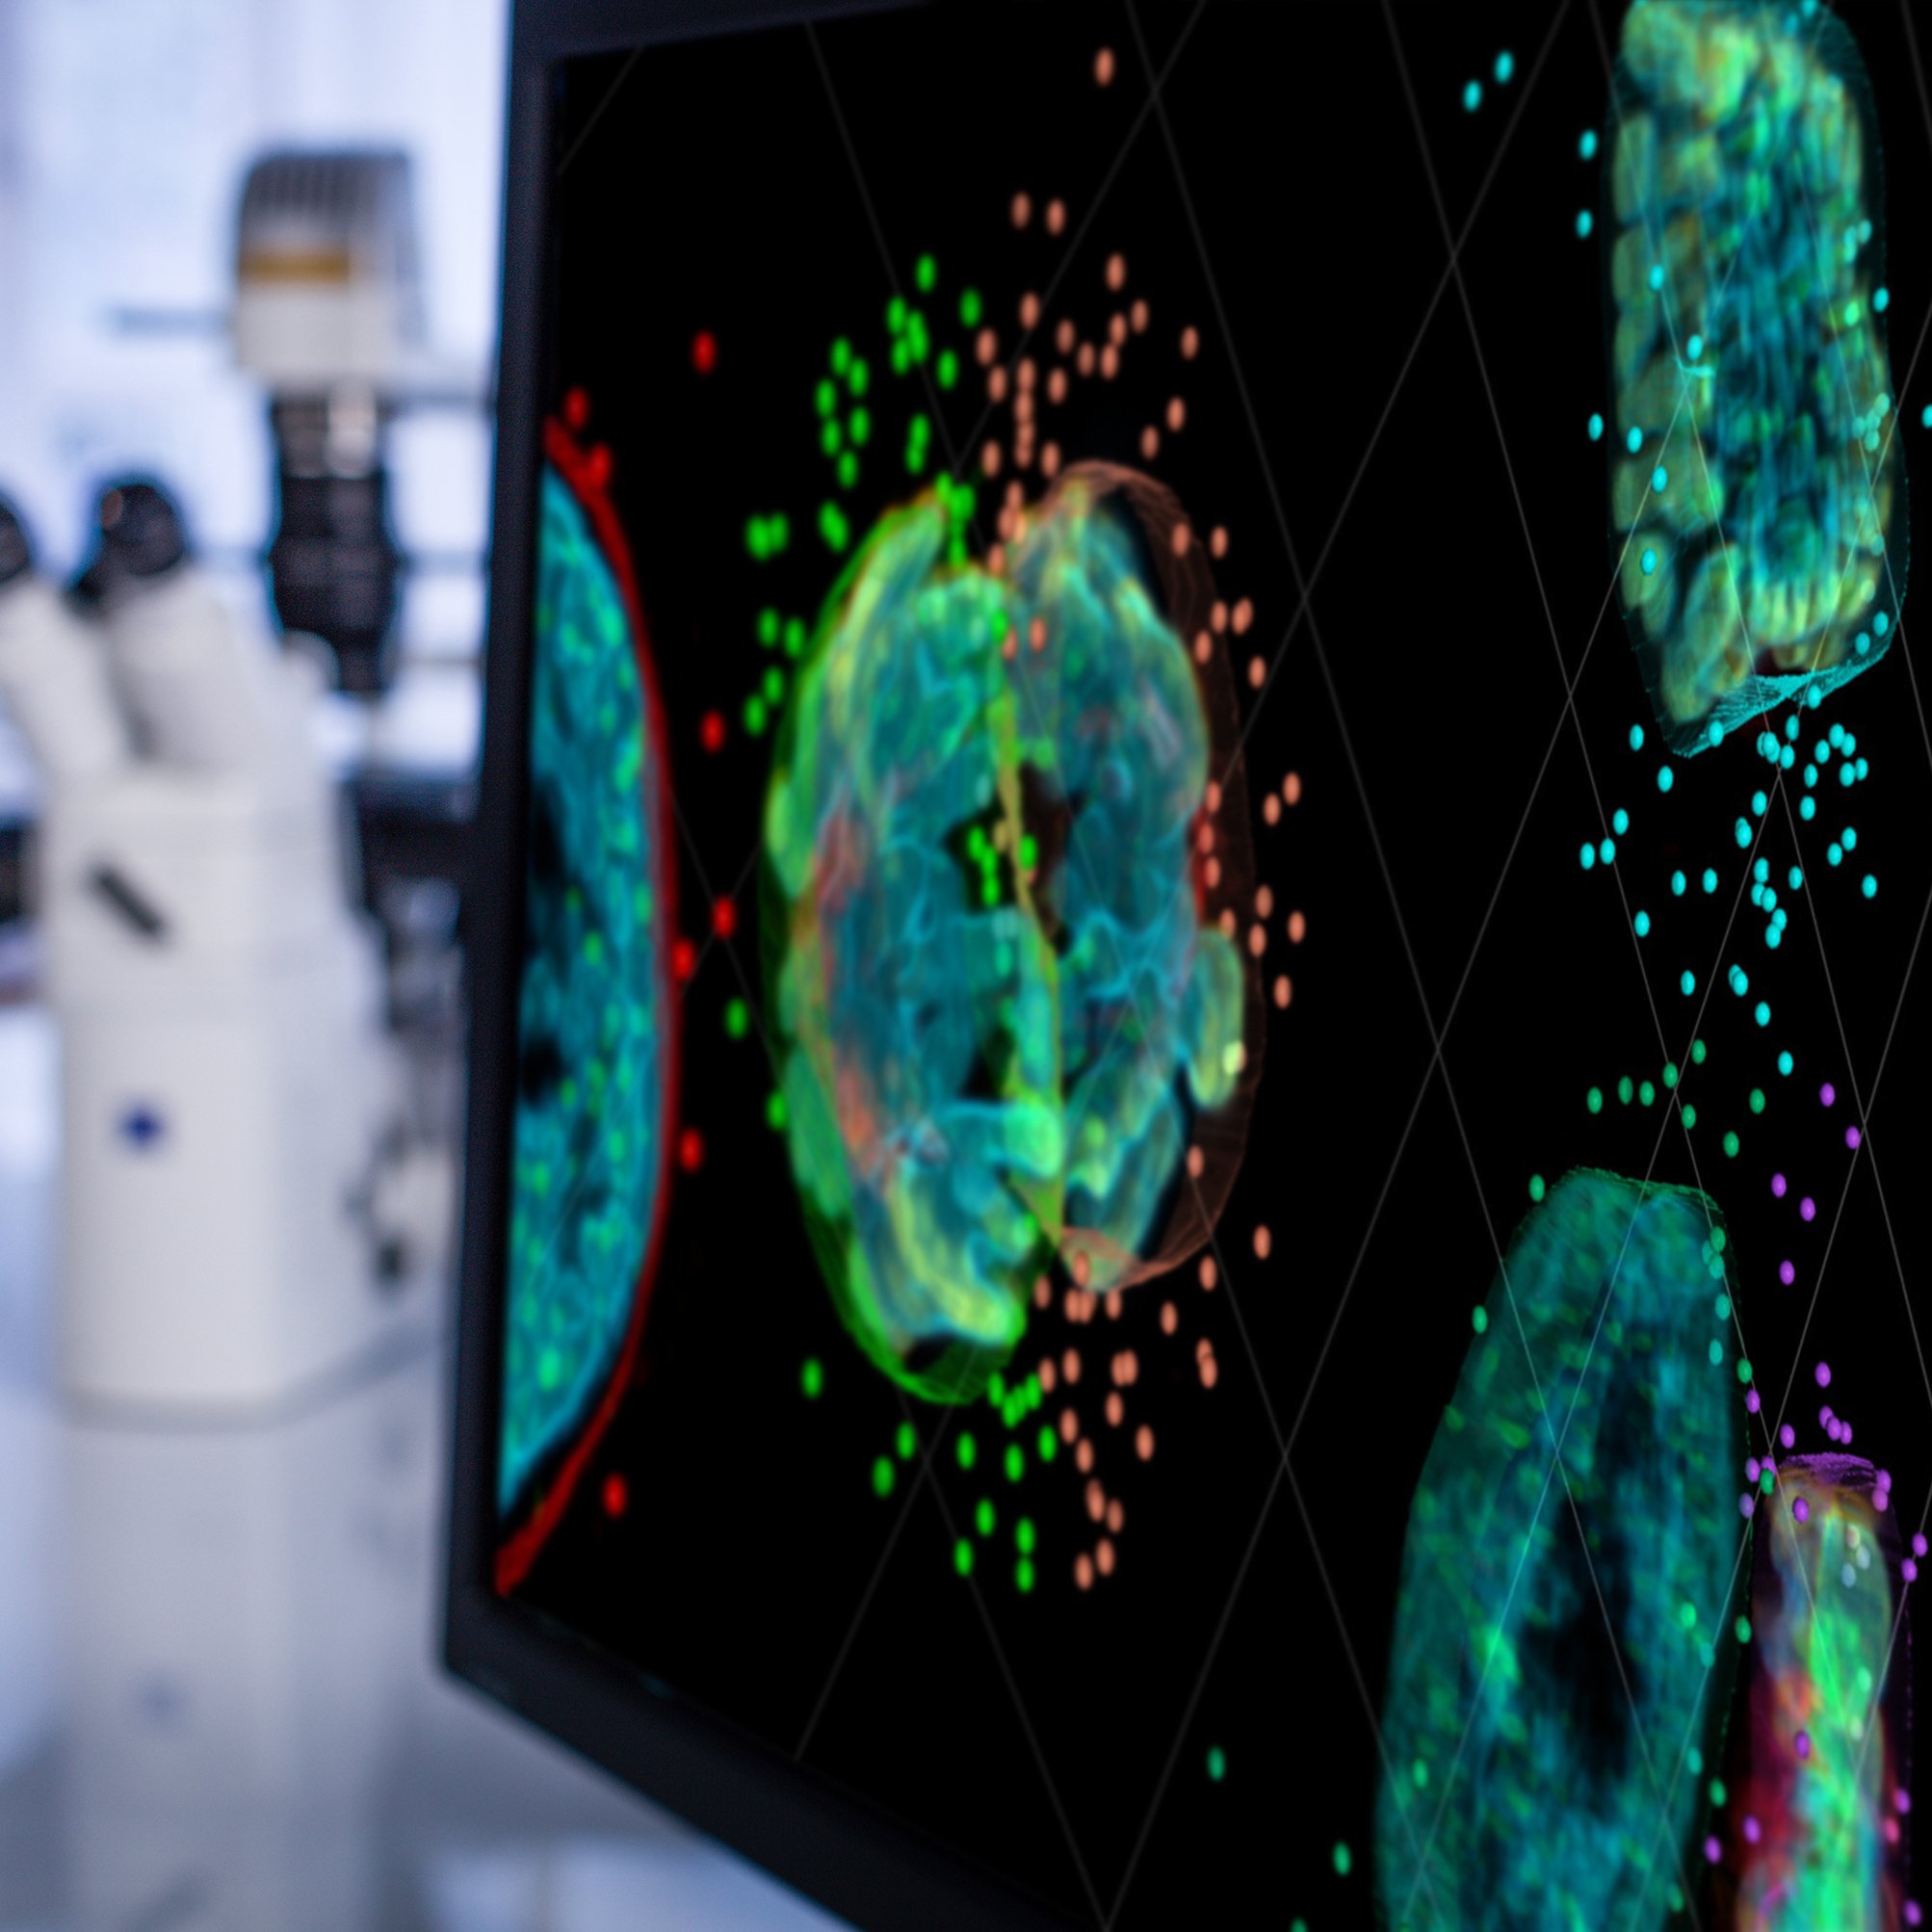
Image analysis has become the bottleneck of many laboratories for diverse reasons:
arivis offers a variety of different services to help our customers with many aspects of the drug development process and document organization.
Full support for building and improving your organization’s imaging competency. We help you improve any part of the process from acquisition to image management.
Efficiencies in process design and screening. We use AI to automate your science workflows and help you implement them within other imaging infrastructures.
Extraction of results from images of any kind. We use our years of experience in image computing and image analysis to help you get the best results as quickly as possible.
Leading institutes and research organizations trust ZEISS arivis for scientific image analysis.